Introduction
As a service to coaching professionals this inaugural biannual review contains a compilation of the most recent scientific research related to the sport of beach volleyball. Our aim is to promote a research-based approach to teaching the game and to provide exposure for authors who are providing insights into how the game is taught, played and learned.
The list is not exhaustive. Effective coaching requires a multi-disciplinary approach that advances well beyond sport in general and beach volleyball in particular. The sheer volume of relevant material being published prevents us from including it all in this space. While we've chosen primarily to include materials that are specific to beach volleyball, citations will occasionally lead readers to more general materials with potentially compelling applications to coaching sport and people.
As a matter of policy full text is available only to open access materials or content readily available in the public domain. It is not our intention to undermine journals' paid subscription policies.
Content
May
Title: Negative Performance Dependence in Beach Volleyball: Does Reception Failure Drive Further Reception Failure in Collegiate Beach Volleyball?
Summary: The purpose of this study was to assess whether players receiving serve in beach volleyball are more likely to pass out of system immediately following an out of system pass than following an in system pass and to identify whether and how experience and pressure variables influence performance following failure.
Link: Full Text
Data: May, 2020
April
Title: Changes in infraspinatus and lower trapezius activation in volleyball players following repetitive serves.
Summary: To examine changes in activation of the infraspinatus and lower trapezius following performance of repetitive jump-float serves.
Link: Full Text
Publication: International Journal of Sports Physical Therapy
Date: April, 2020
Title: Session RPE is a valuable internal load evaluation method in beach volleyball for both genders, elite and amateur players, conditioning and technical sessions, but limited for tactical training and games.
Summary: This study aimed to verify the validity of session subjective ratings of perceived exertion (RPE) method to monitor the internal training load in beach volleyball players by considering sessions related to different genders, competition levels (elite or amateur), and types of session (conditioning, technical, or tactical/game).
Link: Abstract
Publication: Kinesiology
Date: April, 2020
March
Title: Which are the nutritional supplements used by beach volleyball athletes? A cross-sectional study at the Italian national championships.
Summary: This study aimed to evaluate the quantity and the heterogeneity of the nutritional supplementation practices of amateur and professional beach volley athletes competing in the Italian National Championship.
Link: Abstract
Publication: Physical Performance in Team Sports (Special Issue)
Date: March, 2020
Title: Anthropometric profile and conditional factors of U21 Spanish elite beach volleyball players according to playing position.
Summary: The aim of this work was to describe and study the relationship between anthropometric and conditional factors of under-21 high-performance beach volleyball players according to playing position.
Link: Abstract
Publication: Retos
Date: March, 2020
Title: The effect of motivation on the resilience and anxiety of the athlete.
Summary: This study analyzes the influence of motivation of the athlete on resilience, and the latter, on their levels of anxiety.
Link: Abstract
Publication: Revista Internacional de Medicina y Ciencias de la Actividad Física y del Deporte
Date: March, 2020
Title: Do differences between the training load perceived by elite beach volleyball players and that planned by coaches affect nueromuscular function?
Summary: This study aimed to verify the differences between the training load planned by coaches and that perceived by Beach Volleyball (BV) players and observe the effects on athletes’ neuromuscular function.
Link: Abstract
Publication: Retos
Date: March, 2020
Title: The effects of ball impact position on shoulder muscle activation during spike in male volleyball players.
Summary: The ball impact position during spiking in volleyball may influence the pattern of activation of shoulder girdle muscles and, therefore, could be a significant risk factor for shoulder injury.
Link: Full Text (open access)
Publication: Journal of Shoulder and Elbow Surgery
Date: March, 2020
February
Title: Visual and auditory information during decision making in sport.
Summary: The authors investigated the effects of bimodal integration in a sport-specific task. Beach volleyball players were required to make a tactical decision, responding either verbally or via a motor response, after being presented with visual, auditory, or both kinds of stimuli in a beach volleyball scenario.
Link: Abstract
Publication: Journal of Sport and Exercise Psychology
Date: February, 2020
Title: On discouraging environments in team contests: Evidence from top-level beach volleyball.
Summary: This study empirically investigates the adverse effects of unbalanced competition and
negative feedback in team contests in the field. Using a unique data set sourced from top-level beach volleyball.
Link: Full Text (Wiley - Open Access)
Publication: Managerial and Decision Economics
Date: February, 2020
Title: Specific periodization for the volleyball: The importance of the residual training effects.
Summary: The objective of the review is to explain how to use the residual training effects during the elaboration of the the specific periodization for volleyball.
Link: Full Text (open access)
Publication: MOJ Sports Medicine
Date: February, 2020
Title: Performance indicators in young elite beach volleyball players.
Summary: The aim of this study was to analyze tactical and technical behavior across different ages and genders in young, elite beach volleyball players.
Link: Abstract
Publication: Frontiers in Psychology
Date: February 2020
January
Title: Investigating cumulative effects of pre-performance routine interventions in beach volleyball serving.
Summary: This study aimed to investigate the cumulative effectiveness of pre-performance routine interventions on the accuracy of beach volleyball serves.
Link: Full Text (open access)
Publication: Plos One
Date: January, 2020
Title: Offensive scoring in elite women's beach volleyball: An analysis of zone usage in the Olympic Games.
Summary: The aim of this research was to identify the areas of the court used by the offense to score in women's beach volleyball. It is expected that knowledge of offensive zone usage can be useful to develop physical training, strategic, and tactical plans for beach volleyball teams competing at the elite level studied.
Link: Full Text
Date: January, 2020
Title: Beach and indoor volleyball athletes present similar lower limb muscle activation during a countermovement jump.
Summary: The study aimed to compare and correlate the power, height, eccentric and concentric force development rate of 3 sequential attempts of countermovement jump and the respective muscle response in beach and indoor volleyball athletes.
Link: Full Text
Publication: Human Movement
Date: January, 2020
Title: Comparative analysis of the technical-tactical elements of elite men's beach volleyball teams.
Summary: The aim of the study was to perform a comparative analysis of the technical-tactical skills of elite male beach volleyball teams in the 2004 Athens Olympic Games.
Link: Abstract
Publication: Sports Science
Date: January, 2020
Title: Generalized model for scores in volleyball matches.
Summary: The authors propose a Markovian model to calculate the winning probability of a set in a volleyball match
Link: Abstract
Publication: Jounral of Quantitative Analysis in Sports
Date: January, 2020
Title: A systematic review of volleyball spike kinematics: Implications for practice and research.
Summary: This systematic review summarized and critically appraised the literature on the volleyball spike kinematics.
Link: Full Text
Publication: International Journal of Sports Science & Coaching
Date: January. 2020
Title: Perception and action in sports. On the functionality of foveal and peripheral vision.
Summary: The authors examine the roles of foveal and peripheral vision in optimally coupling perception and action in a variety of sports performances.
Link: Full Text (open access)
Publication: Frontiers in Sports and Active Living
Date: January, 2020
Title: Do the eyes tell the truth? Mechanisms of peripheral vision usage and practical implications.
Summary: In team sports, attention must be divided to multiple players in order to monitor their movements and to initiate the correct motor response at the right time. In a series of three experimental studies, this monitoring functionality has been investigated to propose ways for sport-specific investigations on peripheral vision
Link: Abstract
Publication: Bern Open Repository and Information System
Date: January, 2020
Thursday, May 7, 2020
Friday, May 1, 2020
Negative Performance Dependence in Beach Volleyball: Does Reception Failure Drive Further Failure in Collegiate Beach Volleyball?
Introduction
For many years data scientists have studied performance
streaks in sports. Research on the “hot
hand,” for example, has attempted to identify whether positive performance
streaks will drive further success on subsequent plays.[1] Is a basketball player on a scoring streak
more likely to make her next shot? Is a
baseball player more likely to get a hit after several hits in a row? Is a volleyball attacker more likely to get a
kill after multiple successive kills than after multiple successive misses? Belief in the hot hand is common and the
nature of serial performances has been studied across a multitude of sports.[2]
Research has found limited empirical
evidence for a hot hand phenomenon, however, leaving most data scientists to
conclude there is little continuity between successful prior and subsequent skilled
performances in sport.[3]
While hot hand research is abundant the implications of negative
serial performances are less well known.
Here we analyze not performance following success but rather performance
following failure -and specifically whether prior failure drives
subsequent failure in sports performance.
This “cold hand” analysis has received minimal scholarly attention and
the analysis we undertake here is entirely novel.[4]
We consider the “cold hand” phenomenon in the context of
receiving serve in beach volleyball. Our
hypothesis is that serve receive players are more likely to pass out of system
immediately following an out of system pass than immediately following an in system
pass. We anticipate that failure in
serve receive will predict further failure in serve receive by the same player
on the next opportunity when not interrupted by a timeout or a break between
sets.
To gain further insight into how players perform we studied
players’ performances according to experience and pressure variables.
Experience
To determine the influence of experience we analyzed the
data according to players’ graduate years.[5] We hypothesized that players’ experience would
be influential in predicting their likelihood of exhibiting negative
performance dependence habits. We
expected the “cold hand” phenomenon (if we found one) to be greater among
freshmen than among seniors. In other
words, we expected the general likelihood (if we found one) of players to pass out
of system following an out of system pass would be magnified in freshmen and reduced
in seniors.
Pressure
To examine the impact of pressure on performance we examined
serve receive data according to pressure variables associated with game
conditions. We hypothesized that the
impact of prior performance failure would be situational but would be magnified
during times in the game when players perceived the greatest need to perform
well. We predicted that players more
likely would pass out of system following a previous out of system attempt when
the performances occurred near the end of the game and particularly if the
player’s team was behind in the score. Informed
by prior literature on the confluence of performance and pressure,[6]
we anticipated that anxiety induced by (i) prior failure and (ii) situational
game conditions would impair performance and contribute to an increased
likelihood of continued out of system passing.
Experience and Pressure – Interaction Effect
Lastly, we explored the interaction effect of the experience
and pressure variables. We hypothesized
that negative performance dependence would appear most predominantly when game
conditions required the players with the least collegiate experience to perform
under the most pressure.
Implications
The novel analysis we undertake here has implications for
beach volleyball tactics and training.
Serving the player who most recently passed the ball out of system is a
common beach volleyball tactic. If
performance is dependent - out of system passing portends further out of system
passing - then serving the most recent underperformer could result in the optimal
strategy being utilized. But if
performance is not dependent then continuing to serve the same player would have
to be justified by reference to some other strategic consideration than
reception efficacy. Data showing that
poor reception efficacy reduces the effectiveness of offensive scoring in beach
volleyball suggests that the decision of who to serve in this context has
important implications.
For players and coaches our research could improve
understanding of the psychological processes at work when athletes in serve
receive perform following failure.
Understanding post-failure performance can further the development of
training protocols and interventions designed to enhance failure recovery in athletes
- a skill whose value is heightened in
beach volleyball where athlete substitutions are not permitted and performance
under pressure is necessary to success.
METHODS AND PROCEDURE
The purpose of
this study was to assess whether players receiving serve in beach volleyball
are more likely to pass out of system immediately following an out of system
pass than following an in system pass and to identify whether and how experience
and pressure variables influence performance following failure.
Data
Characteristics
We analyzed 55,125
reception attempts by 690 different college beach players during five
collegiate beach volleyball seasons from 2016-2020. We observed a total of 783 matches and 1,766
sets, of which 1,558 were 1st and 2nd sets in a match and
208 were deciding third sets. Players
whose performances were analyzed competed on 41 different NCAA beach volleyball
programs, 34 of which compete in NCAA D-I, 6 of which compete in NCAA D-II and
1 of which competes as a member of the NJCAA.
Data Compilation
Data were compiled
from official matches during the championship segment of the college beach
season. Non-championship competition and
exhibition flights were excluded. Season
by season data on observed reception attempts, numbers of matches and unique
players are displayed in Table 1. The
distribution of players by class year is displayed in Table 2.
Table
1. Observed Reception Attempts, Matches
and Unique Players: 2016-2020

^Number of unique players is for the season indicated. Total number of unique players is 960. The total number of players represented in the study is 1,125.
Table
2. Unique Player Distribution By Class
Year: 2016-2020.
 Plays from which
performance dependence could not be analyzed were excluded, including each
player’s first reception attempt in each set.
Receptions immediately following team, technical, media, medical and
officials’ timeouts were excluded, as were consecutive receptions separated by
an intervening service error, due to the passage of time between the attempts. We chose to include consecutive reception
attempts during intervening (i) side changes by teammates (players choosing to alternate
between one or the other sideline) and (ii) side switches by opponents (pairs
switching sides of the net as required by rule) due to the brief duration of
time involved in those routine movements.
Plays from which
performance dependence could not be analyzed were excluded, including each
player’s first reception attempt in each set.
Receptions immediately following team, technical, media, medical and
officials’ timeouts were excluded, as were consecutive receptions separated by
an intervening service error, due to the passage of time between the attempts. We chose to include consecutive reception
attempts during intervening (i) side changes by teammates (players choosing to alternate
between one or the other sideline) and (ii) side switches by opponents (pairs
switching sides of the net as required by rule) due to the brief duration of
time involved in those routine movements.
Data Coding
From 55,125 observed
reception attempts we identified 17,439 “sequences” of receptions for analysis. A sequence was
defined as two consecutive serve receive attempts by the same player in the
same set without an intervening game break or opponent service error. Each sequence was marked for reception
efficacy according to nine possible outcomes:
IS-IS, IS-OS, IS-A, OS-IS, OS-OS, OS-A, A-IS, A-OS, A-A. [7] Each reception and sequence was coded by (i)
the identity of the player, (ii) the player’s class year, (iii) reception efficacy
(IS, OS, Ace), (iv) score in the game, (v) whether the player’s team was
winning or behind, and (vi) phase of the game by side-change.
Reception Efficacy
and Failure
Characteristics of
“in system” (IS) and “out of system” (OS) receptions, and of reception errors
(A), were identified prior to the start of data collection. Quality control measures were undertaken among
data collectors to ensure consistency and agreement in efficacy rating of the receptions.
Pressure Variable
We measured
pressure according to three variables – (i) closeness of the score, (ii)
whether the reception player’s team was ahead or behind, and (iii) phase in the
game. We predicted that pressure was
greatest when conditions in the game amplified the athletes’ perceived
importance of performing best, i.e. when the score was close, which we defined
as a 3 or less point differential, when the receiving team was behind, or when
the game was nearly over, which we define as in the final side-change.[8] We assigned a cumulative point value to each
of these variables resulting in a total pressure scale ranging from 0 (lowest
pressure) to 3 (highest pressure).[9] Each reception attempt was assigned a
pressure score according to the scale.
Experience
Variable
Experience was inferred from the class standing
associated with each player. Class standing
was obtained from the websites of the schools for which the players were
competing. For players competing in
multiple seasons class standing was updated and linked to each player’s then
current performance.
Uncontrolled
Variables
Variables implicit in beach volleyball and not controlled
for in this study include: (i) wind speed and direction, (ii) temperature,
(iii) wet or dry conditions, (iv) type, inflation and weight of the ball, (v)
position of the reception teams, (vi) characteristics of the serve (speed, type
and angle), (vii) characteristics of the server (handedness and location), and
(viii) overall reception efficiency of each individual player.
Service Reception
- Choice of Performance
We chose to examine service reception because of its’ prominence
in the game. The ability to receive
serve well in beach volleyball drives successful offenses. At the same time serving strategies regularly
emphasize the need for repetitive passing performances. A common serving strategy, for example, is to
“target” one player to receive the majority of the serves. The more the targeted player underperforms
the more serves she will receive both overall and consecutively. Beach volleyball strategy thus places a
premium not just on repetitive serve receive excellence but also on failure
recovery – the ability psychologically to move on to the next play and perform
immediately after failing.
Receiving serve also provides a more controlled
environment for the study of performance dependence than many of the interactive
skills previously studied. Siding out in
volleyball,[10]
scoring in basketball,[11]
winning rallies in tennis[12]
and achieving hitting streaks in baseball,[13]
for example, all have previously been studied in the literature. All are associated with high levels of interaction
among competitors and changes to defensive strategies that mask whether
performance variations are attributable to dependence or other confounding
variables. Service reception, on the
other hand, is a skill performed by a single player without the assistance of teammates
and independently of a defense. It thus
represents a less dynamic and more appropriate environment for the study of
performance dependence than other skills.[14]
RESULTS
Effect of Failure on Performance
Out of System Reception
Analysis of 17,439 series of receptions indicates that failure
in serve receive negatively influenced performance on the subsequent play by
increasing the likelihood that the next ball would be passed out of system. Our results are evidence that negative
performance exhibits dependence and are suggestive of a cold hand in beach
volleyball reception.
College beach volleyball players passed out of system 18.14%
more often following an out of system pass than following an in system pass - a
statistical disparity greater than expected by chance or by players’ base
passing rates. We refer to this tendency
as the “Failure Effect” and will use the Failure Effect as our baseline to
assess the impact of experience and pressure on performance in subsequent
sections.
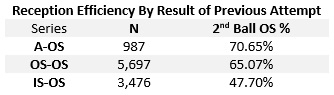
Table 3 shows that 65.84% (n= 6,684) receptions were out
of system after an out of system reception (OS-OS) while 47.70% (n=3,476) receptions
were out of system following an in system reception (IS-OS).
Table 3. Reception Efficiency Following Success and
Failure.

Effect of Reception Error
The negative influence of aces on future performance was
even more significant than was the influence out of system passing. Players were 5.58% more likely to pass out of
system after getting aced (A-OS) than if they had previously passed out of
system without being aced (OS-OS). When
compared to series in which players received the first ball in system, the
negative influence was even more significant.
When players were aced on the first reception attempt (a subset of out
of system passes), they were 22.95% more likely to pass the next ball out of
system. Complete data is shown in Table
4.
Table 4. Effect of Reception Error on Next Ball Reception
Efficiency.
The effect of reception errors on future performance has tactical implications for serving. The data suggests a significant advantage to serving a player who was aced on the previous play, but we repeatedly observed a less optimal approach. Our data show that in nearly 5 out of 10 serves following an ace the serving team missed the next serve (13.3%) or served to a location from which the other passer received the ball (32.8%).
Interpretation of Results
While we found evidence for negative performance
dependence in reception overall this should not be interpreted to mean that
every player exhibited this habit. We
found evidence only for performance decrease following failure among players on
average. The extent to which any
individual player received serve independently from influence of her prior
attempt requires a distinct statistical analysis and is the subject of a
forthcoming paper on that topic. In
terms of aggregating performances for purposes of analyzing the effect of
failure among performance streaks our approach is consistent with at least two
previous studies on negative performance dependence in sport.[15]

Figure A. Influence of Prior Reception on Likelihood of Out of System Passing.
Effect of Experience on Performance
To determine the
impact of experience on negative performance dependence we analyzed serial
passing attempts according to players’ class standing. We hypothesized that experience would be
influential in predicting whether prior failure in reception would lead to
further reception failure. While we
found that freshmen most often exhibited negative performance dependence - a
result we predicted – juniors were least effected by prior failure – a result
we did not anticipate.
Freshmen players,
with the least experience, were the most adversely affected by prior reception failure. Freshmen passed 64.86% out of system
following an out of system pass compared to 46.86% out of system passing following
in system passing. Juniors exhibited the
least negative performance dependence with 64.16% OS-OS reception compared to 49.19
% IS-OS reception. Complete data for all
players across class standings is displayed in Table 5.
Table
5. Reception Efficacy Following Success
and Failure by Experience.


Figure B.
Reception Efficacy Following Success and Failure of Previous Attempt by Experience.
Effect of Pressure
on Performance
To gauge the
impact of pressure on performance serial passing attempts were analyzed according
to several pressure variables related to game conditions. In doing so we were informed by a rich body
of research on the effect of anxiety on athletic performance. For many athletes competition
magnifies the importance of performing well and creates varying levels of
anxiety that paradoxically impairs the ability to perform at a time when
players want most to succeed.[16] We thus anticipated that pressure would
magnify the extent to which beach volleyball players exhibit negative
performance dependence in serve reception.
We further anticipated that the influence of pressure would fluctuate
throughout competition but would be most impactful when athletes perceived the
greatest need to perform well.
Pressure was
measured according to three variables – (A) closeness of the score, (B) whether
the passer’s team was ahead or behind, and (C) phase in the game. Each pressure variable was assigned a value
of +1 point on a cumulative scale and each reception attempt in a series was
assigned a pressure score from 0 (lowest pressure) to +3 (highest pressure) according
to the game conditions at the time of the attempt. Pressure
is characterized as “Low Pressure” (Score of +1), “Moderate Pressure” (score of
+2) and “Highest Pressure” (score of +3).
Data were analyzed for the main and interaction effects of each
pressure condition on reception following failure.
Overall, college beach players exhibited heightened negative
performance dependence under pressure and that effect was magnified as pressure
increased situationally. Complete data are
shown in Tables 6 and 7.
Pressure
– Main Effects
As expected, pressure had a significant effect on reception
following out of system passing. The average
effect of a Low Pressure condition was to increase the Failure Effect from
18.14% to 28.07%. Across all three
pressure variables, playing from behind had the largest negative impact on
performance. Players receiving serve
while behind in the score were 31.35% more likely to pass out of system
following an out of system pass compared to in system pass.
Pressure attributed to the impending end of the game had
the second largest impact on reception following failure. On the final side-change, players experienced
a 26.32% greater likelihood of repeating out of system passing.
Receiving serve while the score was close had the least
effect on player performance. When the difference
in score was 3 points or less players were 25.58% more likely to follow an out
of system pass with a second out of system pass.

Figure C. Likelihood of out of system reception
following out of system reception (OS-OS) compared to
out of system reception
following in system reception (IS-OS) under various Low Pressure conditions.
Our findings could be interpreted to suggest that anxiety
most impairs performance following failure when players are behind in the game. A possible explanation for this could be that
playing from behind is uniquely anxiety producing in a way that the other
pressure conditions - a close game and the end of the game - are not (necessarily),
such as when the score is tied early (e.g., 2-2) or the receiving team is
winning by a large margin late (e.g., 19-10).
In other words, players might always feel pressure when they are behind
but not necessarily feel pressure in a close game or late in the game.
Table 6. Main Effects of Pressure Variables on
Post-Failure Reception (PFR) – Low Pressure.

Pressure – Interaction Effects
Moderate Pressure
The interaction effects of Moderate Pressure were even
more significant than the Low Pressure conditions. Moderate Pressure refers to game conditions
during which two pressure variables existed.
Moderate Pressure, resulting from the interaction of multiple pressure
conditions, increased the incidence of back-to-back reception failure by an
average of 20.59%. Complete data is
displayed in Table 7.
Among Moderate Pressure conditions, (B) playing from behind
(C) near the end of the game had the largest negative impact on performance. Players receiving serve while behind in the
score near the end of the game were 41.28% more likely to follow an out of
system pass with a second out of system pass.
Pressure attributed to game conditions of (B) playing
from behind (A) while the score was close had the second largest impact on
reception following failure. When the
score differential was 3 points or less with the receiving team behind, players
experienced a 37.51% greater incidence of repeating out of system passing.
Receiving serve (A) with the score close (C) during the
last seven points of the game had the least negative effect on
performance. Players receiving serve
under these game conditions showed a 36.59% increased incidence of passing out
of system after doing so on the previous play.
Table 7. Interaction Effects of Pressure Variables on
Serial Reception Attempts – Moderate Pressure.

Highest
Pressure
The three-way interaction effect of (B) being behind by (A)
a close score (C) late in the game created the Highest Pressure condition and
predictably impaired reception performance the most. Under the Highest Pressure there was a 29.60%
increase (to 47.74%) in the rate of out of system passing following reception
failure on the previous play. Given the
number of co-incident variables, the Highest Pressure condition was relatively
rare in the game and represented only 5.63% (n=982) of the observed reception
series.
There was a 47.74% greater likelihood that one out of
system pass will be followed by another at the highest level of pressure
compared to 38.73% under Moderate Pressure and 28.07% under Low Pressure conditions
(average of 3 Low Pressure variables).
The influence of pressure on reception performance is evident in the
increasing difference between post-failure and post-success plays across
increasing pressure conditions.

Figure D. Likelihood of out of system reception
following out of system reception (OS-OS) compared to
out of system reception
following in system reception (IS-OS) under Moderate and Highest Pressure
Conditions.
Interaction of
Pressure and Experience
We next analyzed
the data to determine whether pressure’s impact on performance would vary with
the experience of the players. We
predicted that the Highest Pressure would most adversely impact performance by the
least experienced players. In particular,
we expected that if performance exhibited dependence then failure in serve
receive would predict further failure on the next play and that trend would be
influenced both by the experience of the players and the level (or type) of
pressure in the game.
Overall
The data indicate
that players at every level of experience showed a performance detriment under
pressure. From freshmen to graduate
students, pressure nearly doubled the incidence of out of system passing
following failure (OS-OS) compared to out of system passing following success
(IS-OS). Table 8 reveals the average effect of all
pressure conditions on performance across each level of experience.
Table
8. Average Effect of Pressure Conditions
by Experience.

Freshmen and sophomores
were most impacted by pressure in the aggregate, experiencing an average 18.60%
and 17.12% increase in post-failure out of system passing, respectively. Freshmen under pressure were 38.68% more
likely to pass out of system following an out of system pass than following an
in system pass while sophomores were 36.69% more likely to do so.
Juniors were
least impacted by pressure overall, experiencing 29.07% more out of system reception
following failure than following success. Seniors
and graduate students were moderately impacted by pressure overall, with data
indicating seniors were slightly less affected than graduate students. Under pressure, seniors were 32.05% and
graduate students were 34.43% more likely to pass out of system following
failure than following success.

Figure
E. Interaction Effect of Pressure and Experience on Post-Failure Reception
Performance.
Impact of Pressure
By Experience Level
While pressure
degraded performance regardless of the experience of the players (at no level
of experience were players immune from pressure) the extent to which
performance declined did vary by experience and pressure level, with some
classes showing a greater vulnerability to certain types of pressure than
others.
Table 9 reveals
the most and least impactful pressure conditions for each experience level. Not surprisingly, the largest effects were interaction
effects. The simultaneous co-incidence of
all three pressure variables – behind (B) by a close score (A) late in the game
(C) - is excluded because Highest Pressure uniformly had the largest negative
impact on player reception performance across all experiences levels and
occurred infrequently in competition – just 5.63% of all plays (n=982).
Table
9. Largest and Smallest Effects of
Pressure Variables by Experience of Player.

Graduate Students
Graduate students
were the third most affected by pressure overall, outperforming only freshmen
and sophomores, a trend perhaps owing to graduate students’ general lack of
experience in beach volleyball and specific lack of experience in reception. Graduate students were most likely to repeat
out of system passing when they were behind in a close game (A-B) and least affected
by pressure late in the game (C).
Seniors
Seniors, like
graduate students, were most affected by pressure when behind in a close game
(A-B) and least affected by pressure late in the game (C). Seniors outperformed graduate students,
however, in being less affected by pressure overall.
Juniors
Juniors showed
the greatest resistance to pressure overall compared to both the more
experienced and less experienced counterparts.
Juniors also outperformed their peers in reception efficacy following
failure in the Low, Moderate and Highest Pressure conditions. In line with seniors and graduate students,
juniors were most affected in reception following failure when behind in a
close game and least affected late in the game.
Sophomores
Sophomores showed
the second most vulnerability to pressure ahead only of freshmen, suggesting
that inexperience in college beach volleyball exposes players to greater
performance detriments under pressure.
Sophomores were most negatively affected by pressure while behind near
the end of the game and were least affected when the score was close.
Freshmen
Freshmen were
more negatively affected than their peers in the Low, Moderate and Highest
Pressure Conditions. The data show
uniformly that freshmen performance in reception following failure degraded
significantly under each pressure condition, lending support to our hypothesis
that inexperience would magnify the pressure effect on negative performance
dependence. Across pressure conditions,
freshmen showed the least performance decrement when the score was close and in
this respect resembled their sophomore peers.
Synthesis
Results show that
being behind in the score was the one constant among pressure conditions that
most adversely impacted performance across all experience levels. The results suggest a strategy, when ahead in
the score, repetitively to serve the player who previously passed out of
system, but our data show that nearly a quarter of the time (24.10%) that did
not happen. The extent to which this
phenomenon was due to serving skill or tactics is unknown. Informed by literature on the interacting
influences of fear, failure, anxiety and performance,[17] our
results may be informative in developing optimal serving strategies for
situational advantage in beach volleyball.
The data also
indicate a robust relationship between players’ experience and their
performance under pressure. Players with
the least experience (freshman and sophomores) exhibited the most significant
performance impairments under pressure.
Players with the most beach volleyball experience (seniors and juniors)
were least affected by pressure. The
correlation is not entirely causal, however, as juniors outperformed seniors in
pressure performance, a confounding result we did not expect.
DISCUSSION
The purpose of
this study was to determine whether performance exhibits negative dependence in
beach volleyball reception and whether experience and pressure magnify or
inhibit the trend. Negative performance
trends have previously been identified in professional football[18] and
golf.[19] The current study provides the first
indication that reception performance could exhibit negative dependence in
collegiate beach volleyball.
Our findings are tentative and novel. We found evidence overall that failure in one
play negatively influences performance on the next play in beach volleyball reception. Experience in the sport tended to mitigate
that effect and inexperience tended to magnify it. Experience alone, however, could not be
identified as a cause, as juniors outperformed all other classes in performing
best following failure – although they too were adversely impacted by their
previous performance. Whether the larger
performance decline of less experienced athletes can be attributed to greater
declines in confidence or self-efficacy, or whether the result is function of
motoric experiences,[20]
is a question for future research.
Pressure from game conditions magnified the effect of
prior performance failure as all players across experience levels suffered a
performance decrement under pressure.
While pressure differently impacted players by experience, all groups
shared a common characteristic of performing worst while behind in the game. Pressure tended to impact inexperienced
players most when they were behind near the end of the game. More experienced players tended to be most affected
while behind when the score was close.
Our methodology examined short series of two consecutive
reception attempts. This approach
increased statistical power through a larger sample size than analysis of
longer series would have produced. On
the other hand, our approach precluded us from discovering the extent to which
the prior failure negatively reverberated beyond the next play.
In line with prior research we aggregated our data from
all player performances – again in order to increase statistical power. We found evidence for a “cold hand,” i.e.,
that prior failure negatively impacts performance on the next play. We suspect, however, that the phenomenon is
not individually ubiquitous. Individual
players’ performances over time will best predict how they uniquely respond to
performance failure and will be the best evidence of how data can be used in
match preparation, for example. Our
study is just a starting point for analysis of the question. We think the future of research is in individual
predictive analysis based on individual performance habits. Coaches then can utilize those results as an
adjunct to advanced scouting closer to match day and compare the results
obtained from each source for disagreement or congruence.
The present study could be read to suggest that college
beach volleyball players are susceptible to failure resulting from their own prior
negative performances – particularly under pressure. The finding would not be unique. Research has shown that negative plays more
than positive plays strongly influence players’ subsequent performance in the
PGA and NFL. The amateur status of
collegiate beach players, and the inability to substitute players, points to a
need for the development and use of mental skills interventions designed to
prepare athletes to perform in these circumstances and modulate the negative
effects of prior performance failure. Currently,
timeouts and game breaks provide players with a momentary opportunity to
mentally re-set after failure. But they
are short-term band-aids for a sports performance problem in need of a lasting
solution.
CONCLUSION
This study represents a novel foray into the complex
nature of serial dependency of performance.
Whether, and the extent to which, plays in beach volleyball are
dependent on previous performances remains an issue ripe for further
study. In particular, the psychological
mechanisms through which performance failure appears to portend further failure
and become magnified under pressure should next be studied at the individual
player level. Results could advance our
understanding of post-failure performance and inform the development of
training protocols useful to athletes in failure recovery. For athletes and coaches, the data can also
be a useful guide to optimal tactics in competition and predictive in exposing
opponent’s weakness.
Acknowledgments
The contributions of Shane Spellman and Ali Wood
Lamberson, who reviewed and improved an earlier draft of this paper, are
gratefully acknowledged.
Access and Use
A version of this paper is available for download in portable document format (PDF) here. No fee may be charged for access or use of this document or the information contained therein. The original copyright notice must remain on any downloaded and/or printed version.
Access and Use
A version of this paper is available for download in portable document format (PDF) here. No fee may be charged for access or use of this document or the information contained therein. The original copyright notice must remain on any downloaded and/or printed version.
[1] A
“hot hand” in statistical terms refers to serial correlation in positive
performance results beyond what can be explained by an athlete’s skill or by
chance alone.
[2]
Gilovich, T., Vallone, R. & Tversky, A. (1985). The hot hand in basketball: On the misperception of random sequences, Cognitive Psychology, 17(3), 295-314
(basketball). Otting, M., Langrock,
R.,& Deutscher, C., (2020). The hot
hand in professional darts. Journal of
the Royal Statistical Society. Society A, 183 (2), 565-580 (darts);
Morgulev, E., Azar, O.H., & Bar-Eli, M. (2020). Searching for momentum in
NBA triplets of free throws. Journal
of Sports Sciences, 38, 390-398 (NBA
basketball); Raab, M., Gula, B. & Gigerenzer, G. (2012). The hot hand exists in volleyball and is used
for allocation decisions. Journal of Experimental Psychology,
18(1), 81-94 (volleyball); Clark III, R.D. (2005). An examination of the “hot hand” in
professional golfers. Perceptual and Motor Skills, 101,
935-942 (golf); Dumangane, M., Rosati, N. & Volossovitch, A. (2009). Departure from independence and stationarity
in a handball match. Journal of Applied Statistics, 36(7),
723-741 (handball); Klaassen, F. & Magnus. J. (2001). Are points in tennis interdependent and
identically distributed? Evidence from a dynamic binary panel data model. Journal of the American Statistical Association,
96, 500-509 (tennis).
[3]
Avugos, S., Koppen, J., Czienskowski, U., Raab, M., & Bar-Eli, M.
(2012). The ‘”hot hand” reconsidered: A
meta-analytic approach. Psychology of Sport and Exercise, 14(1),
21-27. There is a growing body of
research finding fault with the statistical methods employed in earlier “hot
hand” research, effectively keeping the debate alive. Stone, D. (2012). Measurement error and the hot hand. The
American Statistician, 61, 61-66; Arkes, J. (2013). Misses in “hot hand” research. Journal
of Sports Economics, 14, 401-410. The hot hand has been analyzed in
non-sporting contexts as well including in hedge fund performance. See Jagannathan, R., Malakhov, A. &
Novikov, D. (2010). Do hands exist among
hedge fund managers?: An empirical evaluation. The Journal of Finance,
65, 217-255.
[4]
Scholarship on the cold hand is limited but includes: Arkes, J. (2016). The hot hand vs. cold hand on the PGA
Tour. International Journal of Sport
Finance, 11(2) 99-113 (evidence of cold hand in golf); Elmore, R. &
Urbaczewski, A. (2018). Hot and cold
hands on the PGA tour: do they exist? Journal of Sports Analytics, 4, 275-284
(evidence of cold hand found).
[5]
Graduate years (or class standing), are a reasonable proxy for collegiate beach
playing experience with the exception of graduate students. Graduate Students typically have 0-1 year of
collegiate beach volleyball playing experience.
[6]
Beilock, S., L. & Carr, T.H. (2001).
On the fragility of skilled performance:
What governs choking under pressure? Journal of Experimental Psychology.
General, 130, 701-725; Eyseneck, M.W., Derakshan, N., Santos, R., &
Calvo, M.G. (2007). Anxiety and
cognitive performance: Attentional control theory. Emotion, 7, 336-353; Gray, R. &
Allsop, J. (2013). Interactions between
performance pressure, performance streaks, and attentional focus. Journal of
Sport & Exercise Psychology, 35, 368-386.
[7]
Terminology is in-system (IS), out of system (OS), reception error or ace
(A). We could have used longer
sequences, such as three OS passes in a row, to define reception failure. Sequences of that length, however, are rare
in beach volleyball and so would have reduced the number of series and our
statistical power significantly.
[8]
When less than seven points were played on the final side change, we coded
plays during the last seven (7) points of the game as though they were
contested on the final side-change.
[9]
Our pressure model is adapted from Harris, D.J., Vine, S.J., Eysenck, M.W.
& Wilson, M.R. (2019). To err again
is human: exploring the bidirectional relationship between pressure and
performance failure feedback. Anxiety, Stress & Coping, 32(6),
670-678.
[10]
Link, D., & Wenninger, S. (2019).
Performance streaks in elite beach volleyball – does failure on one
sideout affect attacking in the
next? Frontiers in Psychology,
10, 919-926; Raab, M., Gula, B. & Gigerenzer, G. (2012). The hot hand exists in volleyball and is used
for allocation decisions. Journal of Experimental Psychology,
18(1), 81-94.
[11]
Gilovich, T., Vallone, R. & Tversky, A. (1985). The hot hand in basketball: On the misperception of random sequences, Cognitive Psychology, 17(3), 295-314.
[12] Klaassen,
F. & Magnus. J. (2001). Are points
in tennis interdependent and identically distributed? Evidence from a dynamic
binary panel data model. Journal of
the American Statistical Association, 96, 500-509.
[13]
Albright, S.C. (1993). A statistical
analysis of hitting streaks in baseball.
Journal of the American Statistical Association, 88, 1175-1183.
[14]
We acknowledge that service reception is influenced by characteristics of the
opponent’s serve and consider this a potential limitation of our findings since
we did not control for the difficulty of the serve. Nor do we think that attempting to do so
would have produced more robust results since “difficulty” is not susceptible
of objective measurement or definition.
Even had we decided to use speed, type and location of serve as
objective indicia of “difficulty,” we have no principled basis for determining
how the confluence of these factors would or would not establish the
“difficulty” of each serve. In any event,
the speeds of the serves we observed were not available and so could not be
included in our analysis. Our data
should be interpreted with this limitation in mind.
[15]
Harris, D.J., Vine, S.J., Eysenck, M.W. & Wilson, M.R. (2019). To err again is human: exploring the
bidirectional relationship between pressure and performance failure feedback. Anxiety,
Stress & Coping, 32(6), 670-678; Link, D., & Wenninger, S.
(2019). Performance streaks in elite
beach volleyball – does failure on one sideout affect attacking in the next? Frontiers in Psychology, 10, 919-926.
[16]
Beilock, S., L. & Carr, T.H. (2001).
On the fragility of skilled performance:
What governs choking under pressure? J. Experimental Psychology.
General, 130, 701-725; Eyseneck, M.W., Derakshan, N., Santos, R., &
Calvo, M.G. (2007). Anxiety and
cognitive performance: Attentional control theory. Emotion, 7, 336-353; Gray, R. &
Allsop, J. (2013). Interactions between
performance pressure, performance streaks, and attentional focus. Journal of
Sport & Exercise Psychology, 35, 368-386.
[17]
Sagar, S.S., Lavallee, D., & Spray, C.M. (2009). Coping with the effects of fear of failure: A
preliminary investigation of young elite athletes. Journal of Clinical Sports Psychology,
3, 73-98.
[18]
D.J., Vine, S.J., Eysenck, M.W. & Wilson, M.R. (2019). To err again is human: exploring the
bidirectional relationship between pressure and performance failure feedback. Anxiety,
Stress & Coping, 32(6), 670-678
[19]
Elmore, R. & Urbaczewski (2018). Hot
and cold hands on the PGA tour: Do they exist? Journal of Sports Analytics,
4, 275-284.
[20]
Carson, H.J. & Collins, D (2015). The fourth dimension: A motoric
perspective on the anxiety-performance relationship. International Review of Sport and Exercise
Psychology, 9, 1-21.
Subscribe to:
Posts (Atom)